Meta Ads provides a solid foundation of basic metrics like ROAS and conversion rate, but savvy marketers know that true optimization lies in the details.
Are your clicks translating into quality visits? Is your audience reach expanding or stagnating? These questions demand more nuanced data.
Below are six advanced key performance indicators (KPIs) that Meta Ads doesn’t readily offer out of the box but which can dramatically elevate your paid social strategy.
1. Awareness KPI: Net new reach
The first missing KPI to add to your Meta Ads strategy should focus on audience reach and saturation.
The key question: Is your top-of-funnel approach attracting people unfamiliar with your brand?
This is crucial for most businesses, especially B2B accounts with longer sales cycles.
Without fresh prospects, you risk depleting your funnel by repeatedly targeting the same audience, leading to diminishing returns.
To answer this question, you will want to tweak how Meta Ads shows your data.
Let’s start with frequency. It’s the average number of times each user saw your ad. The formula is:
- Frequency = Impressions / Reach
Frequency is a powerful KPI for tracking audience saturation, but it comes with two major caveats:
- Frequency is an average. And just like every average metric, it hides discrepancies that can destroy your campaign results. This means you always need to implement frequency caps. Unfortunately, Meta Ads does not always offer such options and you will need to contort your campaign settings to prevent such issues. But that’s a topic for another article.
- It’s bound to a predefined time frame. So you need to break it down to understand its full story:
- Last 3 or 7 days for an immediate snapshot.
- Last 14 or 30 days for your audience’s recent experience.
- Last 90 or 180 days to get a smoothed-out perspective.
- Etc.
This means Meta Ads could easily improve Ads Manager by providing frequency columns with such default time frames. But you have to manually do it. Or do you?
Meta Ads offers an alternate metric called “frequency (cumulative).” However, it’s not available as a column in Ads Manager: you can only get it if you hover over a campaign (ad set or ad) and click on “view charts” and then “customize.”
Here is an example of a retargeting campaign with a budget that’s probably too big for a relatively small audience:
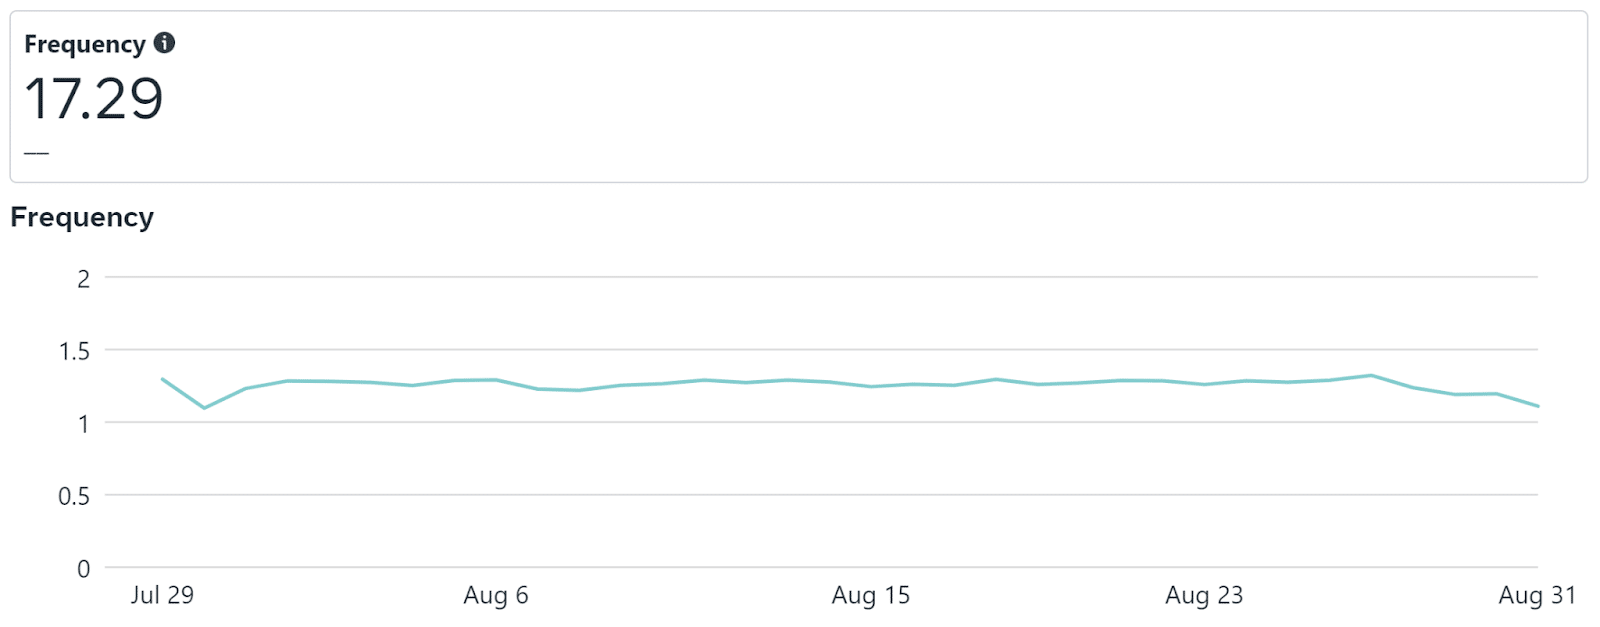
Looking at frequency over time, it looks OK. We’re reaching unique users about once a day.
However, the overall number should trigger some questions: why is it so high (17 impressions in about a month)? If we switch to frequency (cumulative), this is what we see:
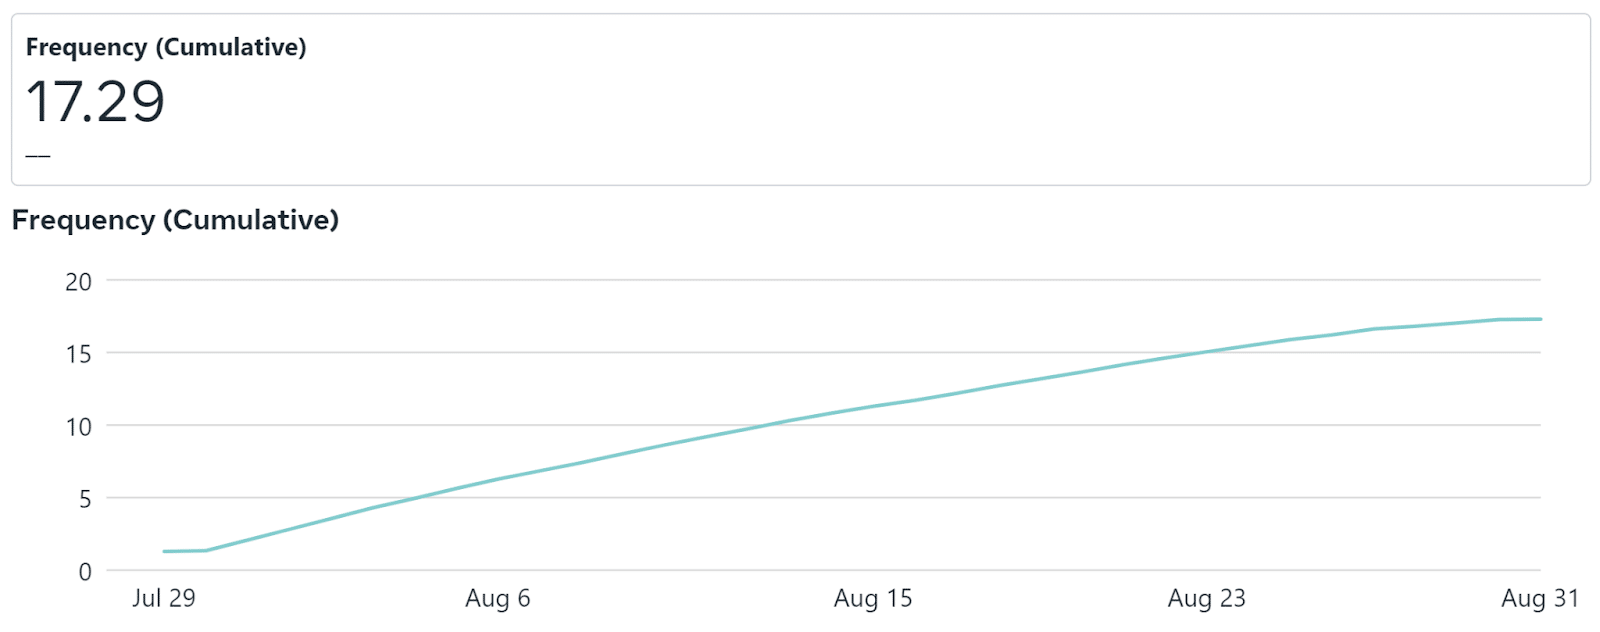
You never want to see such a frequency (cumulative) curve in most scenarios because:
- You don’t want to tap into the same audience indefinitely, resulting in a dried-up top-of-funnel.
- You want to anticipate such a scenario and avoid reactive behavior. That way, you avoid seeing performance go up and down and up and down again.
The question is: how?
Unfortunately, Meta Ads does not provide an easy way to do this: frequency (cumulative) sits at the campaign level only, and its sister KPI, reach (cumulative), too.
Also, it can’t be found in the regular data exports (API, Ads Report, etc.).
You’ll need to create a custom KPI called net new reach to accomplish this. Here’s the formula:
Net New Reach = Reach(s→y) – Reach(s→m)
With:
- Reach(s→y) being Reach from your start date (“s”) to yesterday (“y”)
- Reach(s→m) being Reach from your start date to a middle point in time (“m”)
This lets you know how many new users you reached who were not exposed to your ads before “m.” net new reach has two advantages:
- Unlike frequency (cumulative), it adapts to your granularity needs up to the account level. You can export its root component (Reach) relatively easily through the API, the user interface, etc.
- It shows your latest net new reach, which allows for anticipation. If it falls week over week (for example), you know you want to act to avoid saturating your audience
Now, there’s still one caveat with net new reach. You need to make it a recurring exercise (weekly?) and build a nice table out of that to make it digestible. Fortunately, since it’s recurring, it means it’s automateable.
I suggest exporting Reach(s→y) weekly to your database of choice and running a script to subtract Reach(s→y) from the previous week’s Reach (s→y) (that is, Reach(s→m), from the perspective of that new week).
That way, you will end up with a table like the one below, with “s” being your start date and “y” being yesterday, the date of the data pull.
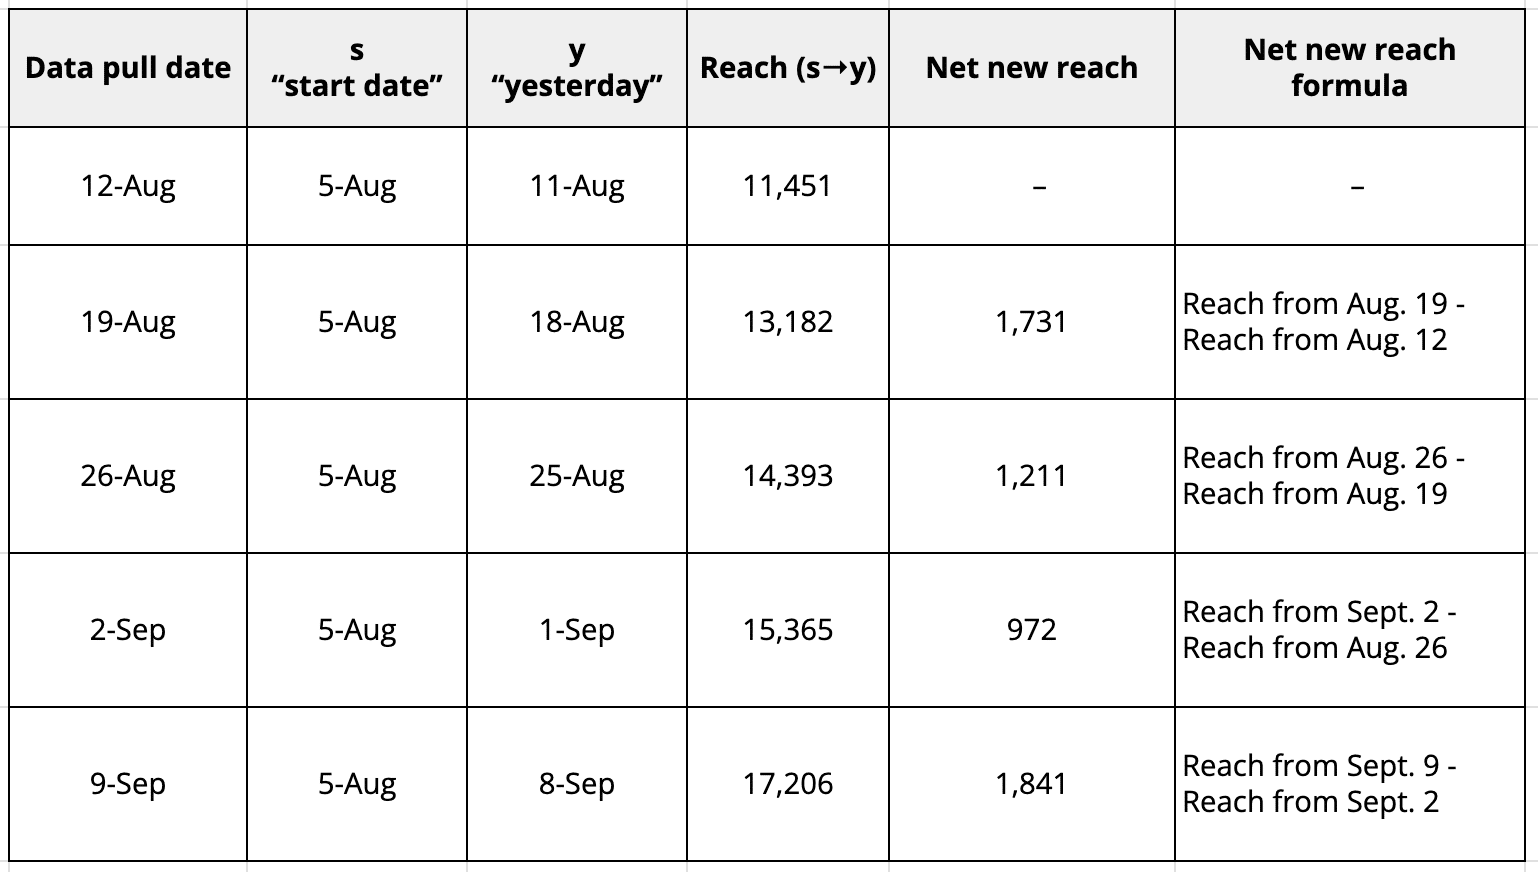
Once that table is ready, you only need to graph net new reach and/or analyze it weekly to know whether you have a top-of-funnel saturation challenge.
In the table above, since the net new reach is much lower than reach (s→y), it indicates that we’re not bringing in enough new users to our top-of-funnel tactics and/or have a disproportionate budget compared to our audience size.
Dig deeper: B2B audience targeting: Meta Ads as an alternative to LinkedIn
2–3. Engagement KPIs: Hook and retention rates
Another area where Meta Ads could do better is the engagement stage of the funnel.
If you ask me, when it comes to engagement, the most important goal is to catch users’ attention in a crowded feed or string of Stories and Reels. What they do next (from leaving a comment to purchasing) is up to the next stages of the funnel.
When your ad is catchy enough, it gives you a chance to:
- Deliver your message.
- Push your audience to complete the action you want them to take.
These two items can be calculated very easily using Meta Ads’ custom metrics:
- Hook rate: Determine if your ad is catchy enough to stop users from scrolling and grab their attention.
- Formula:
- Hook Rate = 3-second video plays / Video plays
- Formula:
- Retention rate: Check if your ad is well-crafted to deliver its message and encourage users to act (though this mainly ties into CTR and conversion rates).
- Formula:
- Retention Rate = ThruPlays / 3-second video plays
- Formula:
Using these two metrics, you can determine whether to improve your ad’s hook or body. This will help you create better-performing assets at a lower cost since you’d only need to adjust one part.
However, Meta Ads doesn’t offer the same depth of raw KPIs for images as for videos, which is unfortunate. Despite using it internally, a metric like dwell time could easily resolve this issue, but Meta Ads has yet to make it available to advertisers.
In the meantime, I don’t see a solution other than using CTR to determine whether an image engages well.
4. Traffic KPI: Quality visit rate
Like the engagement stage, the traffic stage of the funnel could benefit from additional KPIs.
Once your ad grabs users’ attention, the goal is to prompt them to take action. While Meta Ads provides various click-based KPIs to measure this, they tend to be fairly shallow.
Meta Ads doesn’t tell you whether that click was valuable: Did those users bounce? Did they consume your content in-depth?
You will not know unless you have enough typical conversions (purchases, leads, etc.).
In those cases, how do you assess performance? The good news is that you have everything you need to do so, and easily!
Your first goal should be to define what is a quality visit. One way to look at this is to consider users who, once they reached your website, did one or more of the following actions:
- Visited at least two pages.
- Scrolled all the way down to the bottom of your landing page.
- Spent more than 30 seconds on your landing page.
- Played a video on your landing page.
With these simple triggers, you can set up a custom conversion in Meta Ads. This allows you to optimize your campaigns with the new KPI and evaluate your landing page’s performance using the quality visit rate.
Here’s the formula:
- Quality Visit Rate = Quality Visits / Landing Page Views
I recommend using landing page views to filter out clicks that weren’t tracked due to issues like cookie consent or ad blockers. This way, you’ll have a reliable KPI for your analysis.
Dig deeper: 3 powerful micro-conversion strategies for paid social
5-6. Performance KPI: Lifetime value and benefits
While those KPIs may seem like a stretch since you typically need an analytics or CRM solution to access that data, it’s disappointing that Meta Ads doesn’t fully leverage its integrations with tools like GA4, HubSpot and Salesforce to showcase its true business value.
Still, I believe every PPC should periodically review these metrics. Here are the formulas you need to calculate:
- Lifetime Value (LTV) = average order value x total transactions / unique customers
- Lifetime Benefits (LTB) = LTV x profit margin
I wrote an entire article on this exact topic, so feel free to check it out and dive deeper into LTV.
KPIs to elevate your Meta Ads strategy
Meta Ads offers a robust set of KPIs for campaign management, but advancing your measurement and optimization capabilities requires the creation of more sophisticated metrics.
KPIs such as net new reach, hook rate, retention rate, and quality visit rate, along with more complex metrics like lifetime value, provide deeper insights into campaign effectiveness, allowing for more informed decision-making beyond just ROAS or conversion rates.
Hopefully, Meta will recognize the value of integrating these metrics directly into Ads Manager. In the meantime, savvy PPCs can leverage these advanced KPIs to stay ahead of the competition.
Dig deeper: Here’s why PPC now looks more like paid social and what it means
https://searchengineland.com/meta-ads-advanced-kpis-track-success-446811